Bridging the Gap Between Reader and Text
In the realm of words, not all texts are created equal. Some dance and sing, accessible to all; others lock themselves away, cloaked in complexity. How do we measure the distance between the reader and the page? Enter the Fry Graph, a tool developed in the 1960s by Dr. Edward Fry that bridges this gap.
The Fry Readability Graph offers a visual, graph-based approach to assessing text difficulty. Unlike formulas that produce a single number, the Fry Graph uses a two-dimensional plot to determine reading level, making it both intuitive and scientifically validated.
The Origins of the Fry Graph
Dr. Edward Fry developed the Fry Readability Graph during a period of significant educational research. As a Fulbright Scholar in Uganda, he helped teachers teach English as a Second Language (ESL) from 1963 onwards. During these early days, he developed readability tests based on graphs, publishing "A Readability Formula That Saves Time" in the Journal of Reading in 1968.
This initial graph-based test scored readability through high school and was validated with materials from primary and secondary schools, as well as results from other readability formulas. The graph proved so effective that Fry extended it in his 1977 book "Elementary Reading Instruction" to test through the college years. He discovered that a student's vocabulary continues to grow and change during college, requiring an extended scale.
Fry went on to become Director of the Reading Center at Rutgers University and an authority on how people learn to read. His work on the Fry Graph has influenced readability assessment for decades.
Validation and Research
The Fry Graph has been extensively validated through various studies, demonstrating its accuracy and reliability:
- Journal of Social Studies Research: Validated the graph for assessing the readability of an eighth-grade social studies textbook.
- Reading Research and Instruction: A study published in this journal validated the Fry Graph's accuracy within one grade level, comparing it favorably to the Flesch Reading Ease and the Dale-Chall Formula.
- Primary-Level Validation: Another study validated the Fry Graph against the Spache Formula, the cloze technique, and oral reading for primary-level books. This study showed the Fry Graph yielded the same level scores as the Spache Formula.
- United States Office of Education: Used the Fry Graph to score and validate 23 selected instructions, publications, and forms commonly used by adults.
- RAND Study: Scored and validated English and Spanish versions of surveys developed for the Consumer Assessment of Health Plans Study (CAHPS), demonstrating the graph's versatility across languages.
This extensive validation makes the Fry Graph one of the most trusted readability assessment tools, particularly in educational settings.
How the Fry Graph Works
The Fry Graph is simple to use and understand, yet powerful in its accuracy. The graph uses two key measurements:
- Horizontal axis: The number of sentences per 100 words
- Vertical axis: The number of syllables per 100 words
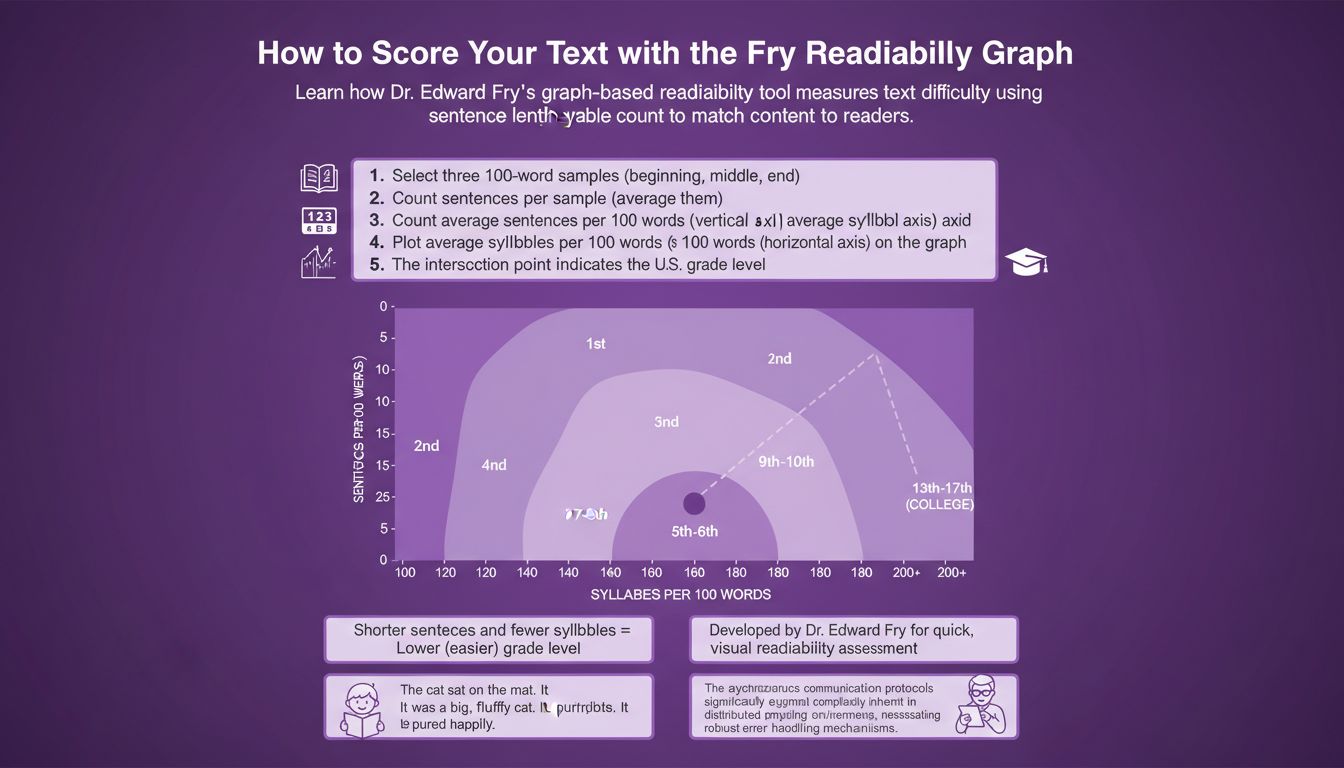
By plotting these two values on the graph, you can determine the approximate reading grade level of your text. The point where the two lines intersect falls within a grade level zone, indicating the readability of the text.
Step-by-Step Guide to Using the Fry Graph
Here's how to score your text using the Fry Readability Graph:
Step 1: Select Your Samples
Take three 100-word passages from your text—one from the beginning, one from the middle, and one from the end. This ensures you get a representative sample of the entire text. When counting words, eliminate numbers from the word count (treat them as separate elements).
Step 2: Count Sentences
Count the number of sentences in all three 100-word passages. For the last sentence in each passage (which may extend beyond 100 words), estimate the fraction to the nearest 1/10th. For example, if a sentence is 60% complete when you reach 100 words, count it as 0.6 sentences.
Step 3: Count Syllables
Count the number of syllables in all three 100-word passages. Create a table to organize your data:
| Sample | Number of Sentences | Number of Syllables |
|---|---|---|
| First 100 words | — | — |
| Second 100 words | — | — |
| Third 100 words | — | — |
| Total | — | — |
| Average | — | — |
Step 4: Plot on the Graph
Enter the graph with your average sentence length (sentences per 100 words) and average number of syllables. Plot a dot where the two lines intersect. The area where the dot is plotted signifies the approximate reading grade level of your content.
Step 5: Using Online Tools
If you use an online tool or software, you can process the entire text as a sample rather than just three 100-word passages. This provides a more comprehensive assessment of your text's readability.
Understanding the Non-Linear Design
As you examine the Fry Graph, you'll notice it's not linear. It uses a more complex layout with curved boundaries between grade levels, much like the Raygor Readability Graph. This design reflects an important truth: readability doesn't increase in a straight line.
The graph is designed to focus on small changes in syntax, especially in lower and higher grade levels:
- Lower grade levels (Grades 1-3): Small differences in count affect readability significantly. A few extra syllables or one more sentence can move a text from one grade level to another.
- Higher grade levels (Grades 9 and above): The boundaries stretch out, meaning larger changes are needed to move between grade levels. This reflects that advanced readers can handle more variation in text complexity.
This non-linear design makes the Fry Graph more accurate in estimating readability for a wide range of texts, from children's books to college-level materials.
Interpreting Results
When using the Fry Graph, it's important to understand that results are invalid if they appear in either the top right or bottom left corner of the dark blue areas on the graph. These areas represent combinations of sentence length and syllable count that are unlikely or impossible in natural language.
If your plot falls in a valid area, the grade level indicated is your text's approximate reading level. Remember that this is an approximation—actual readability depends on many factors beyond sentence length and syllable count, including vocabulary familiarity, subject matter complexity, and reader background knowledge.
Why the Fry Graph Matters
The Fry Graph may feel vintage, but its underlying concept is highly contemporary. Understanding your audience's reading level isn't just helpful; it's essential for effective communication. The graph is widely used by:
- Educators: To select appropriate reading materials for students at different grade levels
- Researchers: To assess the difficulty of texts in academic studies
- Publishers: To classify and market books to appropriate age groups
- Writers: To ensure their content matches their target audience's reading abilities
Particularly valuable for educational purposes, the Fry Graph helps ensure that reading materials are neither too easy (leading to boredom) nor too difficult (leading to frustration and comprehension failure).
Advantages of the Fry Graph
The Fry Graph offers several advantages over formula-based readability measures:
- Visual representation: The graph provides a visual way to understand text difficulty, making it easier to see how different texts compare
- Comprehensive validation: Extensive research has validated its accuracy across multiple studies and contexts
- Grade-level specificity: Provides direct grade-level scores, making it easy to match texts to readers
- Wide range: Covers reading levels from elementary school through college
- Educational focus: Designed specifically with educational materials in mind
Limitations to Consider
While the Fry Graph is a valuable tool, it has limitations like all readability measures:
- Sample size: Manual calculation requires selecting representative samples, which may not capture the full complexity of longer texts
- Subject matter: Doesn't account for subject-specific vocabulary or concepts that might be familiar to certain readers
- Context: Doesn't consider reader motivation, background knowledge, or interest in the topic
- Language features: Focuses on sentence length and syllables but doesn't account for other factors like sentence structure complexity or use of passive voice
Use the Fry Graph as one tool among many when assessing text difficulty, always considering your specific audience and context.
Getting Started with the Fry Graph
Ready to assess your text's readability? Our Fry Graph Calculator helps you score your text automatically, eliminating the need for manual counting and plotting. Simply paste your text, and the calculator will analyze it using the same principles Dr. Fry developed decades ago.
Whether you're an educator selecting classroom materials, a publisher classifying books, or a writer ensuring your content matches your audience, the Fry Graph provides a reliable, validated way to assess text difficulty. In a world where clear communication is essential, tools like the Fry Graph help bridge the gap between writer and reader, ensuring that your words reach their intended audience effectively.